Lab 5: Platform Operations, analyzing metrics and log aggregation
Overview
Duration: 45 minutes
In lab 2, we deployed Flex Gateway to protect our Payments API. In this lab, we will generate load, so that we can analyze API Telemetry using Anypoint Platform. This provides the ability to keep track of key metrics like: top client applications, analysis of number of transactions, failures and performance in a set of interactive, graphical dashboards and charts.
You will learn how to keep track of key metrics like total requests and requests responding with an error. From there, you will see how we can analyze logs from flex gateway in Anypoint Monitoring.
API Manager stores up to 100 MB of logs per API instance for 30 days. Runtime Manager automatically purges logs that go beyond 100 MB per API instance. If you need more storage, you can either use a third-party service (configured through a policy) or sign up for a Titanium subscription that further extends the capability to analyze API Telemetry, such as the ability to easily analyze Distributed Log Aggregation, Advanced alerting and dashboard creation, runtime Log point injection and much more. If you want to explore these more advanced features, ask your instructor for a dedicated live demonstration.
Step 1: Generate Requests and Errors
To start this lab, you will call the flex gateway you deployed in Lab 2 with a curl command on your web terminal. You will do API calls that succeed and fail to compare and contrast monitoring’s troubleshooting features.
We assume that you already have a Web Terminal with your Flex Gateway running (as it was the last step in Lab 2).
The first thing that we are going to do is to stop your Flex Gateway docker container and restart it in daemon mode, so that we free up that web terminal ro run some commands.
-
Go back to the Web Terminal and stop your Flex Gateway container process by typing:
Ctrl C |
-
Now, let’s run it again, but add a special -d flag, so that the container runs in the background in daemon mode and that way, we can free up the terminal to run our load generation requests.
docker run -d --rm -v "$(pwd)":/usr/local/share/mulesoft/flex-gateway/conf.d -p 8081:8081 mulesoft/flex-gateway-
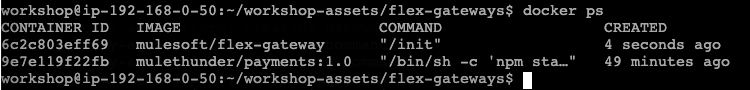
Verify that Flex Gateway container is running by typing
docker ps-
You should see 2 containers, the payments microservice that we initiated in Lab 2, as well as Flex Gateway container.
-
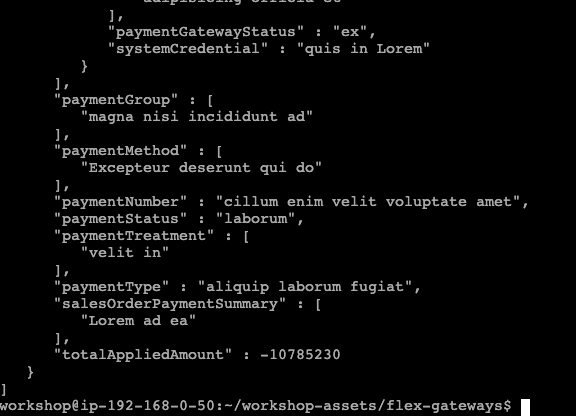
Let’s test that we can still invoke our Flex Gateway. Since we are in the same VM where it is running, we can simply do a localhost invocation to the port where the APIInstance was configured in Lab 2 (i.e. 8081)
curl -u max:mule localhost:8081/payments | json_pp-
This should also return the same JSON payload that we saw before from Payment service.
-
Now, let’s generate some load using an incorrect username and password combination, so that the result is always a 401 Unauthorized response.
while true; do curl -u max2:mule localhost:8081/payments ; sleep 1 ; done |
WARNING: This command will always fail because the authentication is wrong - it will generate error logs for further analysis.
Note: Since you can invoke your Payments API externally to your VM, you don’t necessarily have to use a "Web Terminal". Feel free to use your own terminal if you are using Mac or simply have access to “any terminal” or “API Client tool” with the ability to generate load of API requests. For this, just make sure to use the external IP Address of your Ubuntu VM.
-
Now in the new terminal, run another command to generate more load. This time, we are going to use the right credentials, but since we are limiting the number of requests with a “Rate Limiting” policy that allows only 2 requests every 30 seconds, then just a few requests will work, while the majority will fail with a “429 Too Many Requests” violation.
while true ; do curl -u max:mule localhost:8081/payments ; sleep 1 ; done-
Wait a few minutes for both of these commands to run and generate enough data in the Control Plane.
Step 2: Viewing API Analytics
-
Go back to Anypoint Platform Web Console and navigate to API Manager.
-
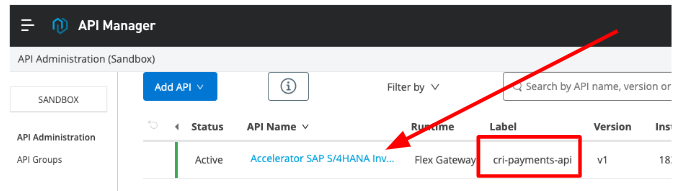
Open your Payment API that you configured in Lab 2.
Make sure to use the one with your prefix. You can validate that in the Label column

-
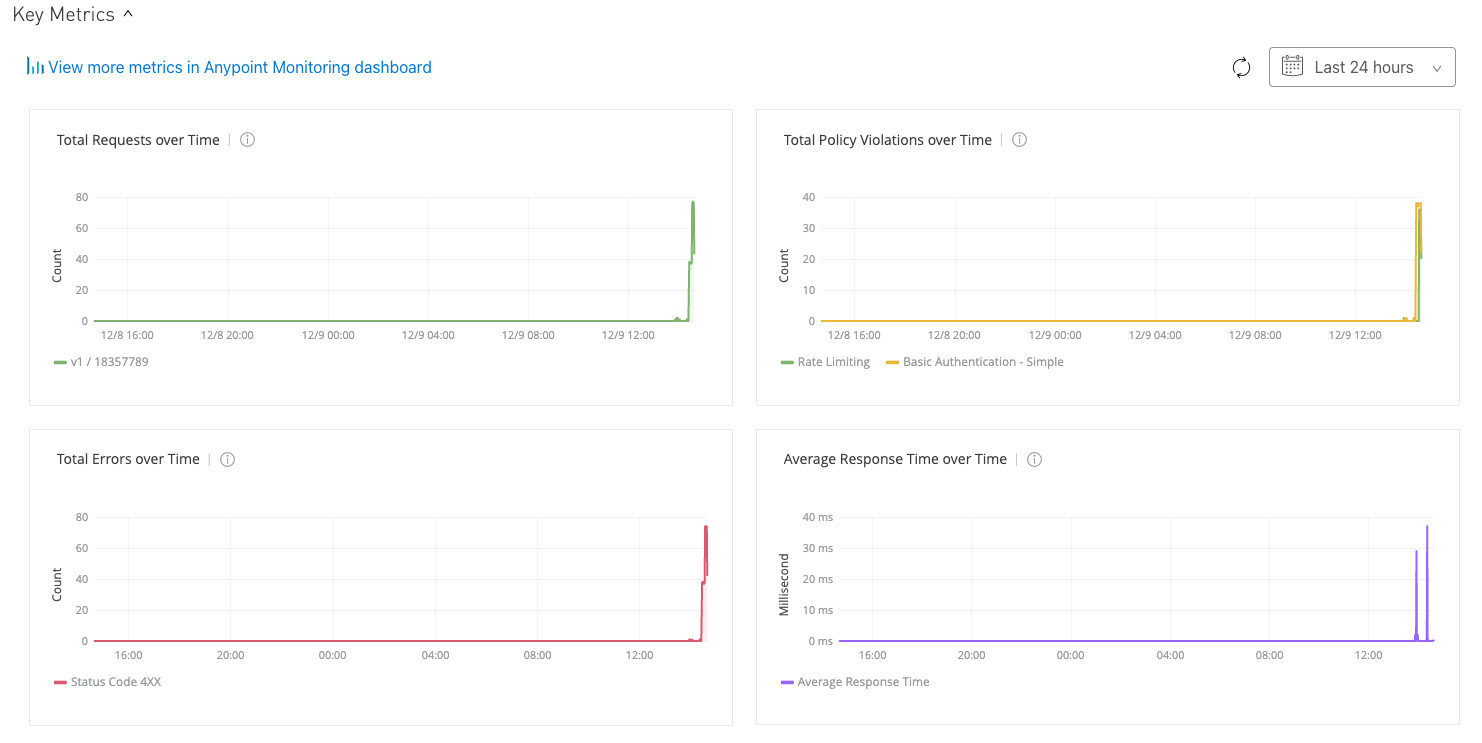
You should be able to see a lot of movement in the different graphs.
-
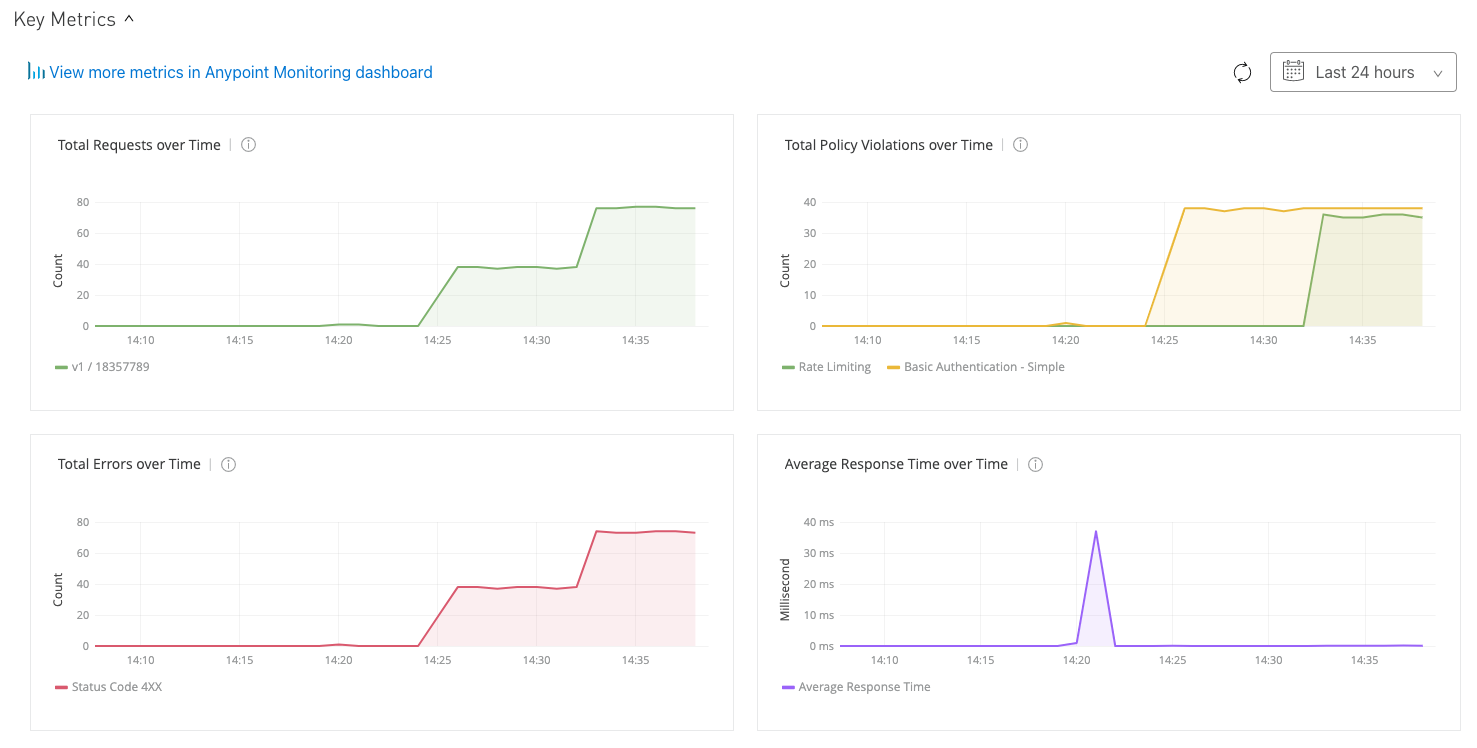
With the mouse select over any of the charts “a range” across the activity period, so that you get a zoom in on the Monitoring across all charts
-
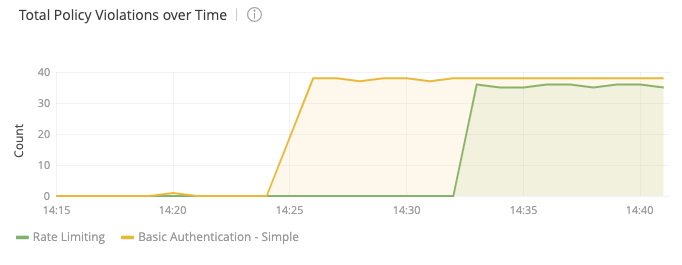
You can see across the 4 top metrics, the total number of requests and policy violations both increasing.
-
If you focus on the top right chart, you can see data across the 2 policies that we are forcing to fail by design, ie. Rate Limiting and Basic Authentication
-
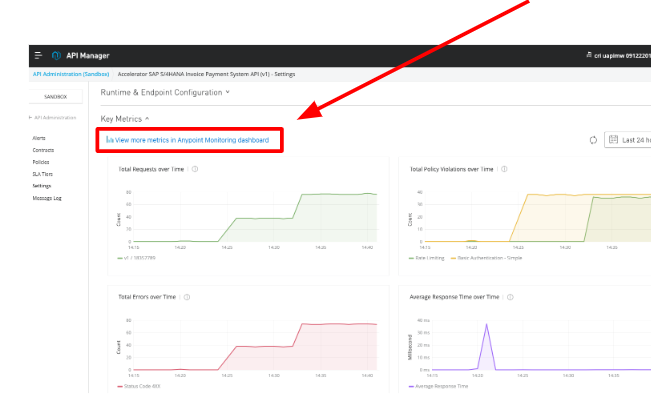
Next, click “ View more analytics in Anypoint Monitoring Dashboard ” to see more information.
-
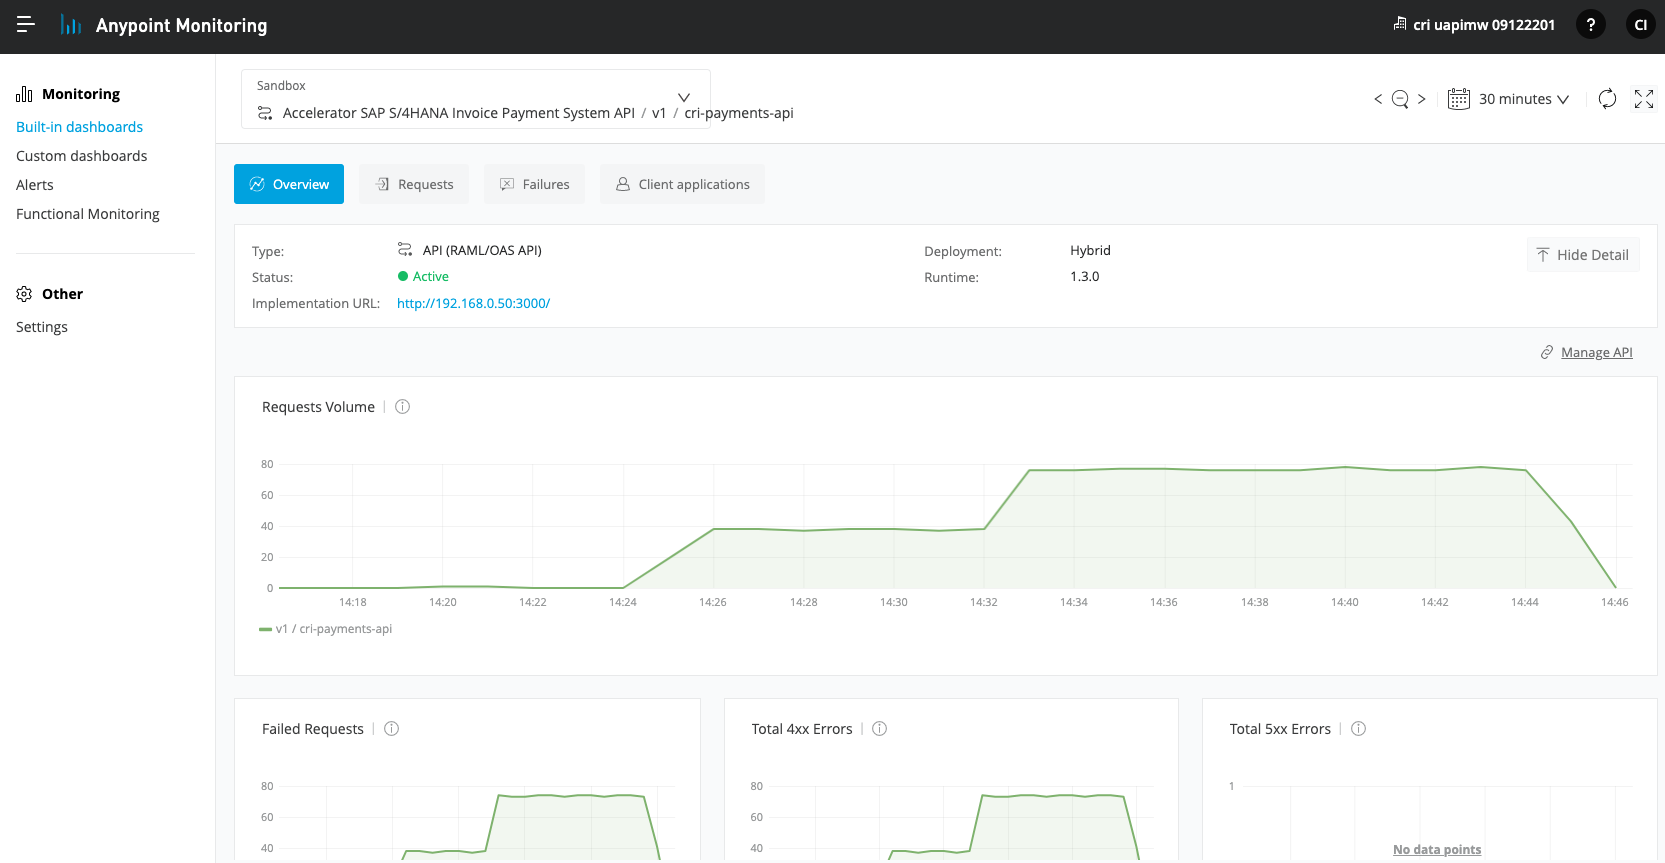
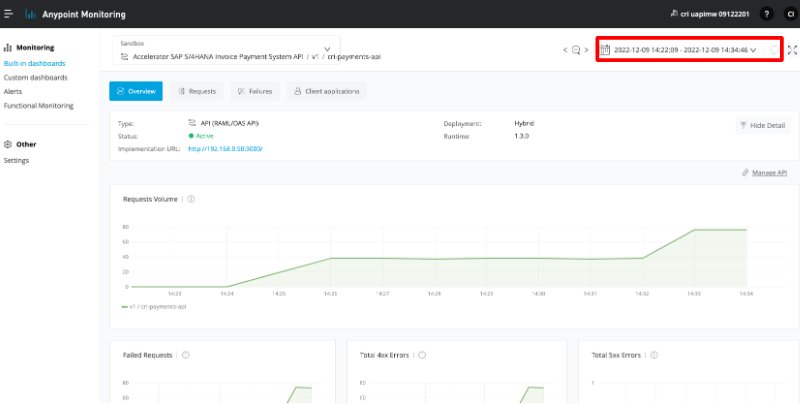
Notice that for every API that you create in API Manager, a new Dashboard will be built in Anypoint Monitoring using some of the most common API metrics, sent in real time by Flex Gateway. However, you have the option to create your own custom dashboard using a wider range of API metrics being pushed by Flex Gateway.
-
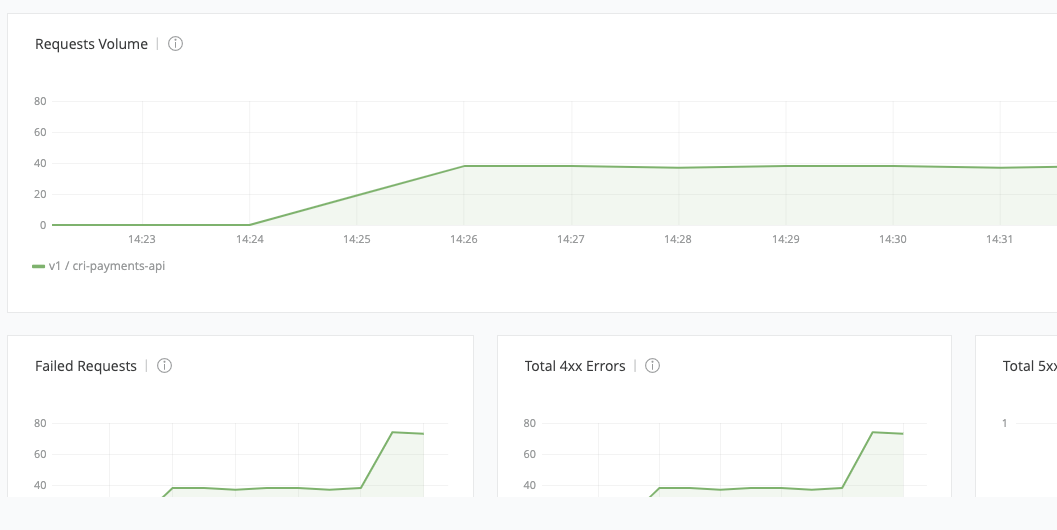
Let’s analyze the auto-generated built-in dashboard. On the overview page, you can see total request volume and breakdowns of failed requests.
-
If you are experienced running MuleSoft Applications, you will notice that this is the same place, skills and tooling that we use to monitor Mule APIs. This is great, as your Mule and Non-Mule enterprise APIs can all be monitored and Managed from the same Control Plane in 1-single Platform.
-
Also, notice that you can also use your mouse to select periods of time on top of any chart and all charts will filter on that period, so that you can always analyze different metrics across the same time window, all in one place.
-
Another option is to click on the date at the top right, to change the time range for which the dashboards display information. If you toggle the auto-refresh box, you will see live metrics for your API - which should still be receiving new requests from your terminal.
-
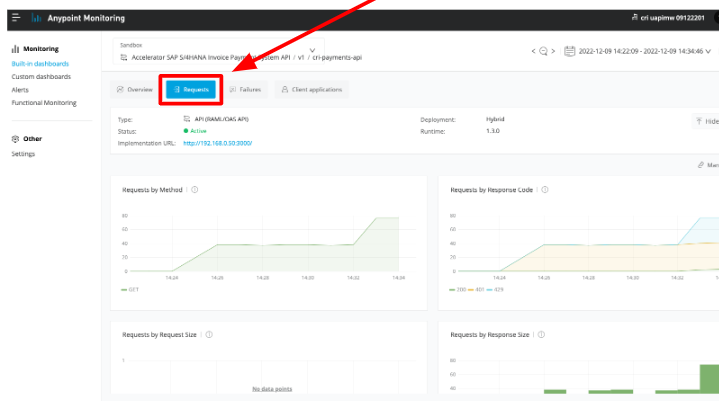
Now, click the requests tab.
-
Here, we can see the requests by response code and we will see numerous 401 and 429 code responses, with just a minority being 200 code responses. Let’s analyze some of the charts:
-
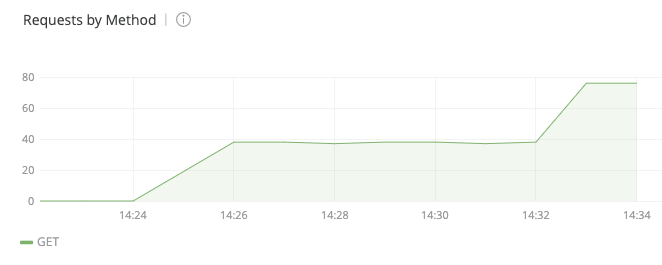
Requests by Method : We just configured our requests to send GET calls, so that is the only one we see, but in a normal more complex API, we can see a very interesting breakdown of API activity split by methods.
-
-
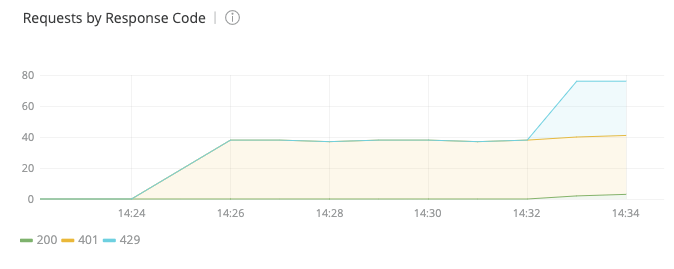
Requests by Response Code: Here, we can see graphically the amount of load that has been generated, split by response code. As you remember, every second we are sending an unauthorized request, but also, every second, we are alternating across sending just a couple of successful requests and forcing the majority ending in a 429 Too Many requests violation. So at the end, we see that many requests are doubled as “too many requests”, being represented very clearly in this chart “with colors”. This is great, because that means that even though the password is incorrect, by design a rate limit policy will protect APIs from Denial of Service attacks.
-
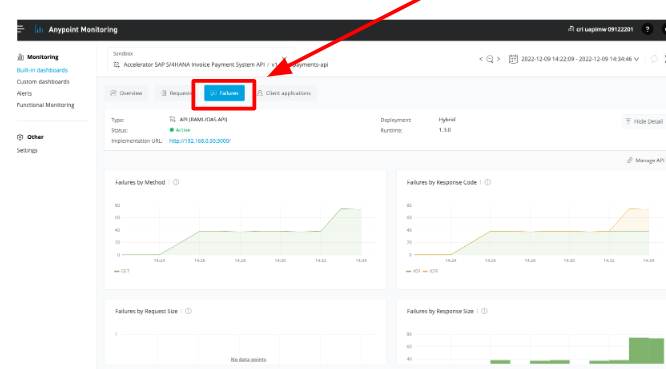
Now, click on Failures
-
Here, we can see some interesting charts created automatically. For example:
-
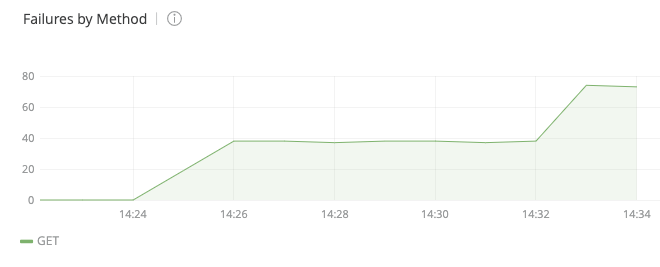
Failures by Method : Again, since we just configured our API calls to send GET requests, that is the only one we see, but in a normal more complex API, here we can see a very interesting breakdown of API activity split by method being called.
-
-
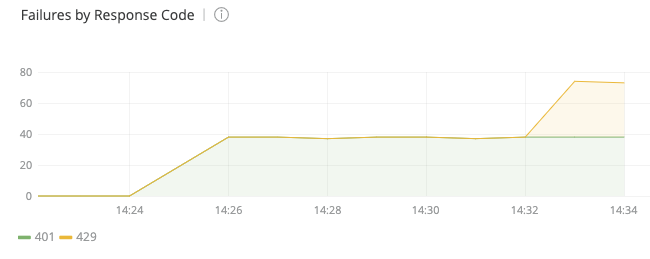
Failures by Response Code: This chart only shows the split by failures, so the successful responses with 200 response code have been removed and it will only show the errored ones.
-
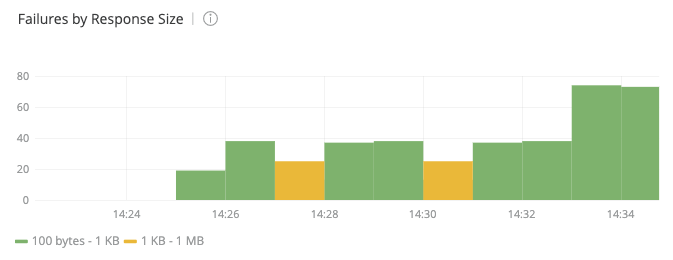
Failures by Response Size: This chart will show the breakdown of responses by size. This will vary mainly because only some responses will contain the actual 200 code and will return a full JSON payload, while the majority will contain a shorter message about the type of error.
-
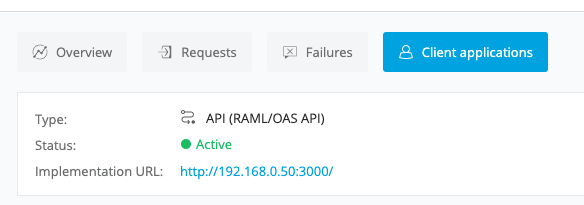
The last tab, “Client applications” is empty, as we did not use Client ID based Authorization access. In a normal API deployment configuration, this is another great way to secure access to your APIs and further provide Rate Limiting - SLA based access, leveraging API contracts that can be automatically or manually approved, providing different tier-based API Service Level Agreements.
Step 3: Logging Messages in Anypoint Monitoring
Flex Gateway allows us to seamlessly connect to API Manager where we can create alerts, apply policies, manage SLA tiers for varying levels of access and also log messages.
In this step we will create a message logging policy and then view our logs inside API manager.
-
Go back to API Manager and select your Payments API that you configured previously. Make sure to select the one with your prefix.
-
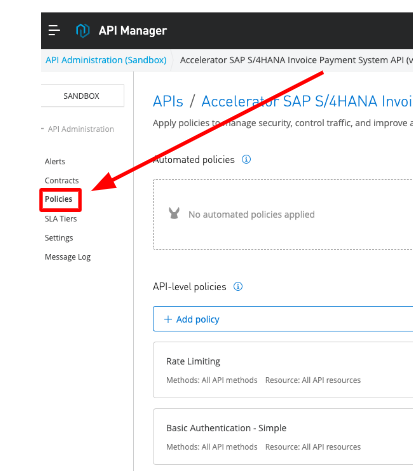
On the left side of the screen select Policies
-
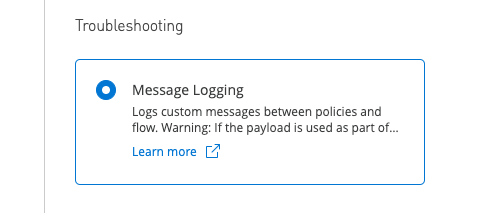
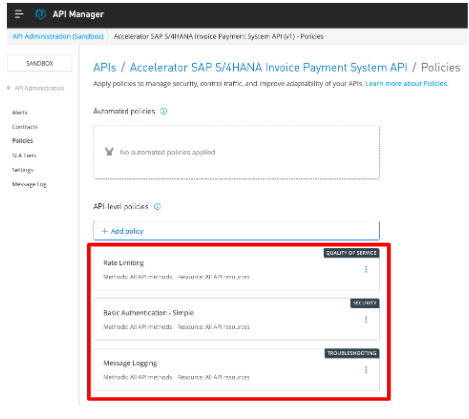
Select Add Policy followed by Message logging under the Troubleshooting section at the bottom of the screen. Then, click Next .
-
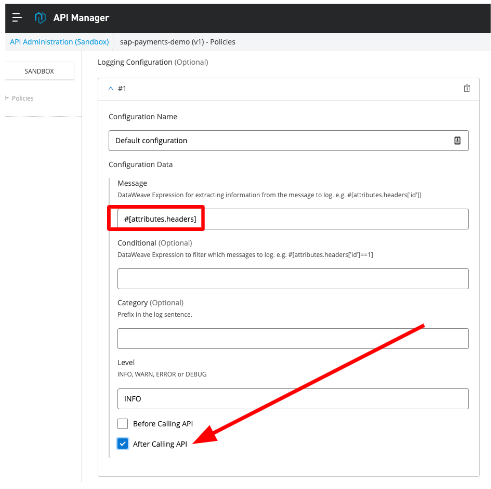
From this page, we will only update the Message component. Go ahead and add a DataWeave instruction to log the response HTTP Headers .
#[attributes.headers] |
Note: You can use a wide variety of DataWeave structures, operators, selectors, functions and variables to inject at runtime the right data that you wish to be logged in Anypoint Platform. In the step above, we are logging the HTTP headers. Other options include: API methods, URIs, queries, parameters, authentication information, payload, variables, etc. For a full list of DataWeave structures supported in Flex Gateway refer to the official documentation _.
-
Ensure “After API is called” is checked.
-
Finally, click Apply .
-
You should have 3 policies at this point
-
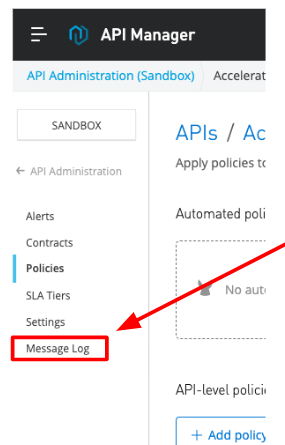
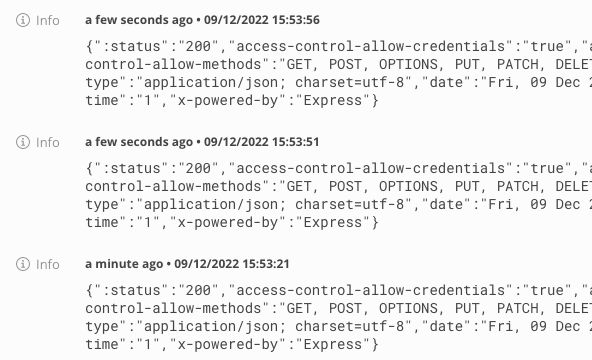
Now we are ready to test the Logging Policy. On the left side of the screen select Message Log .
-
Here you will see an output of all logged messages based on the attributes you selected earlier.
Note: We assume that you are still generating traffic, if not go ahead and send a few get requests to the payments API from your terminal
curl -u max:mule localhost:8081/payments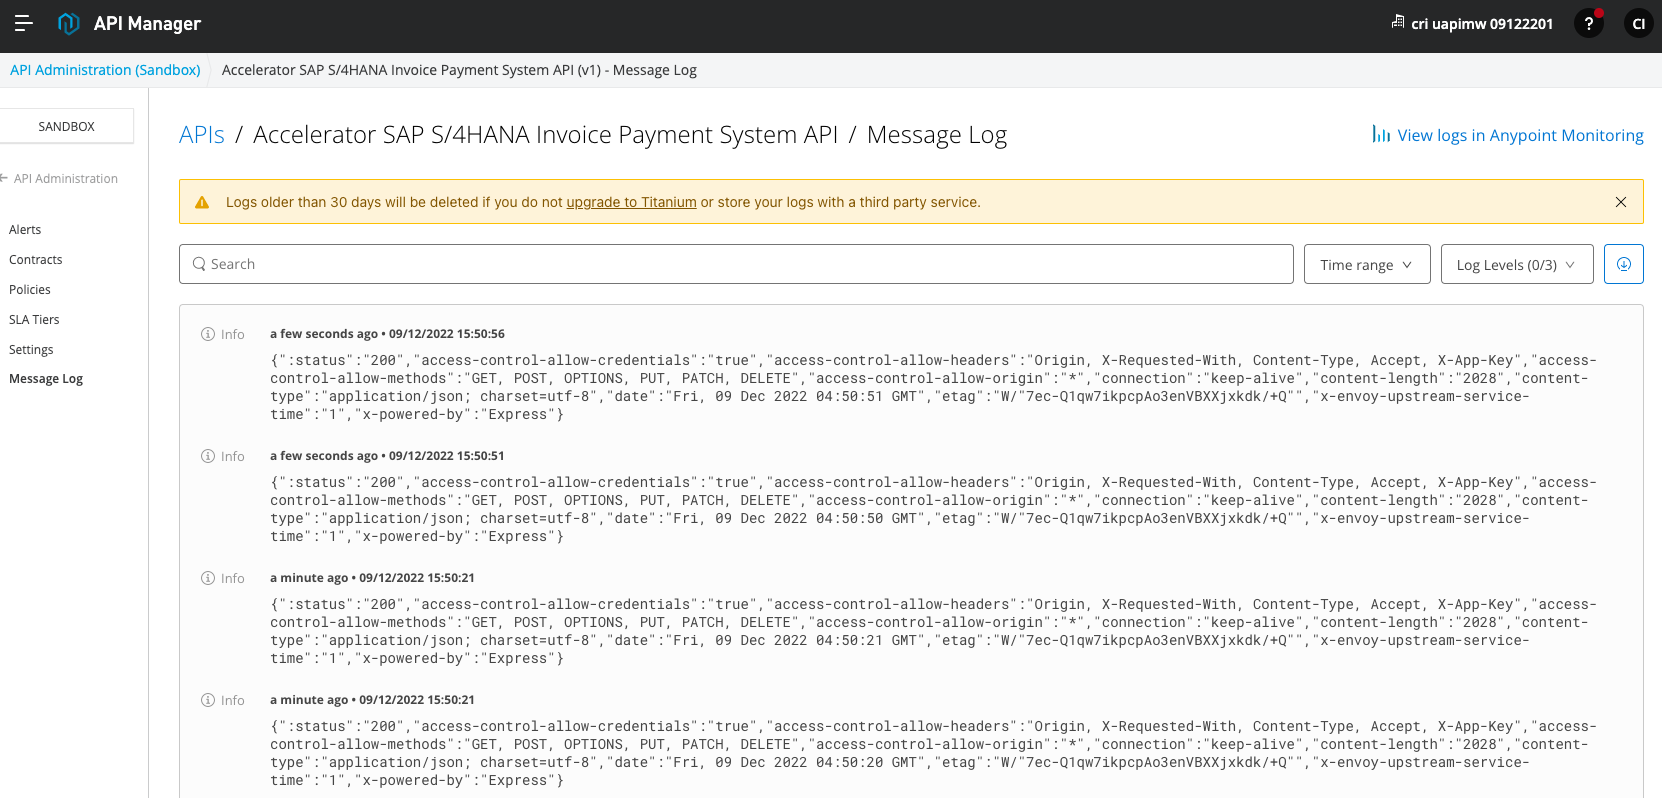
-
You will see the logs displayed. Feel free to edit your configuration and adjust the message data to be logged. Also, try the search capability to filter out messages based on your Logging selection.
-
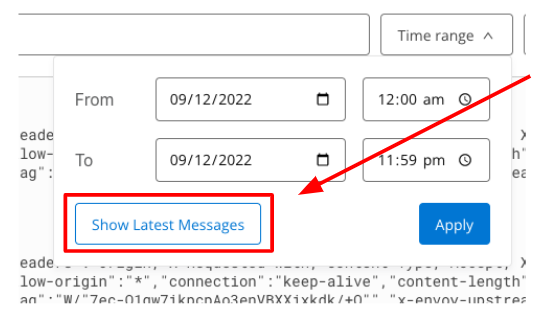
On the top right of the screen, you can use the “Time range” filter, to pick a specific window to examine.
-
You can also click the “Show Latest Messages” to easily see the latest messages.
-
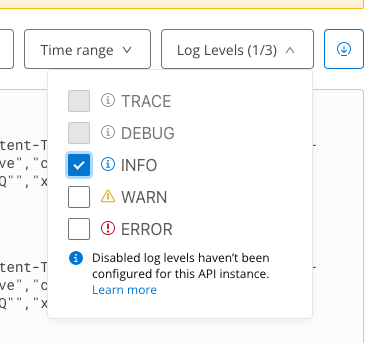
Also you can adjust the “Log Levels” - so that you can filter for certain information based on the debugging level. All of this configuration is enforced at runtime by the AnypointPlatform, without affecting your APIs or microservices.
-
In this lab you should just have the “INFO” flag returning log data.
Congratulations, you have successfully completed a quick overview on some auto-generated dashboards generated by Anypoint Monitoring, based on some basic API metrics pushed by Flex Gateway to the control plane.
Also, remember that in this lab, we covered basic analysis of API Telemetry. Using advanced Anypoint Monitoring capabilities, it is easy to further extend the capability with things like distributed log aggregation analysis, which is important if you are running multiple replicas of Flex Gateway across multiple Availability Zones, for example. Also you can extend using advanced dashboard and alert creation, expand retention sizes and periods, etc.
If you want to explore these capabilities, please request this to your instructor for a dedicated session on Anypoint Monitoring full capabilities.